FlexGantt is the most advanced Swing-based Gantt charting framework currently available for Java. It uses a very high abstraction level, which allows it to be applied in various and often very different domains such as ERP systems, production planning and scheduling applications, manufacturing execution systems or project portfolio management applications. FlexGantt and its predecessor framework DJT have been used and tested by hundreds of professional planning and scheduling applications. The customer list contains companies such as Siemens, Boeing, NASA, JPL, Lockhead Martin, Raytheon, Kuehne + Nagel, SAIC, General Dynamics, ABAS, Bauer, etc…
MVC. Model View Controller.
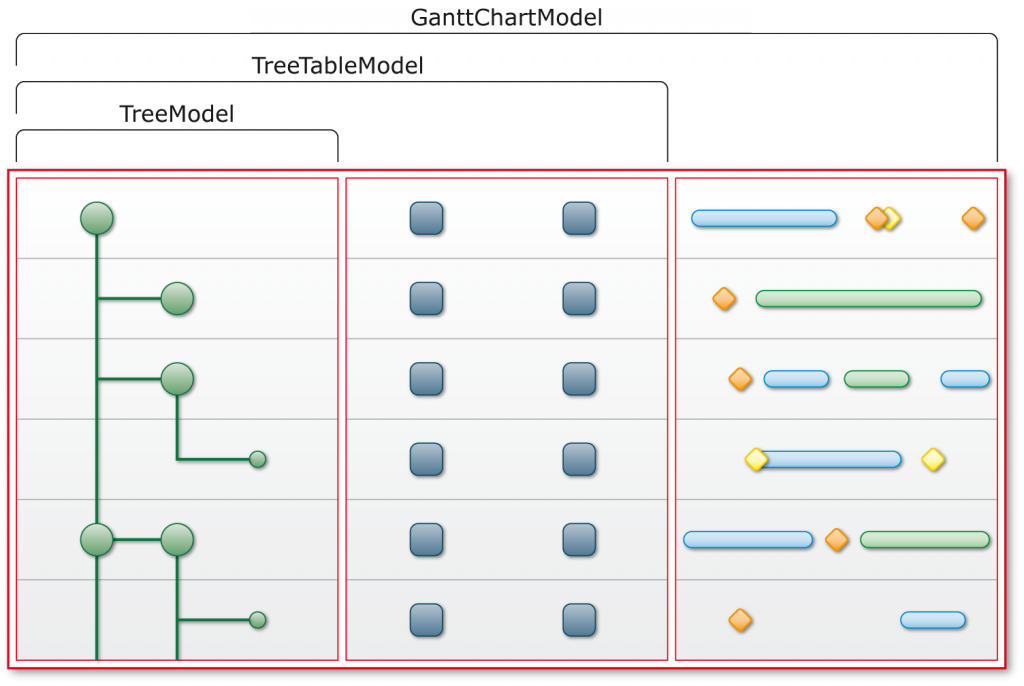
FlexGantt follows the same MVC approach that Swing is using. Several different models are used for various purposes. A calendar model keeps track of holidays and weekends. A paging model supports the user in loading different planning horizons, a bookmark model stores the application- and user-defined bookmarks. The primary model, however, the one that feeds the Gantt chart component with data is the Gantt chart model. It is an extension of a tree table model so that it can populate the left-hand side of the Gantt chart with data (the left-hand side is a tree table). It also returns so-called timeline objects that are displayed on the right-hand side underneath the timeline. Timeline objects represent activities, tasks, events, milestones, pretty much anything that can be placed on a timeline because it can be associated with a time point or a time span. The following graphic depicts the structure of a Gantt chart model.

Layers. For things that belong together.
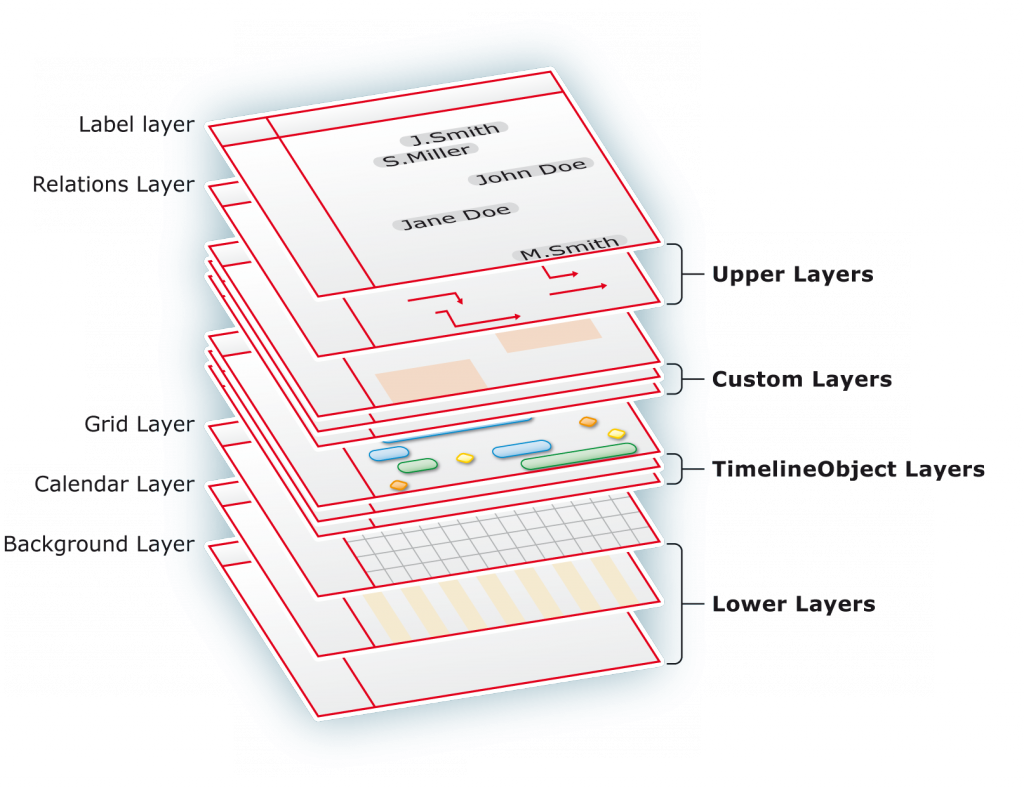
FlexGantt uses a very unique layering approach that is known from graphics and mapping applications. Each Gantt chart consists of a set of system layers, which provide the core functionality (e.g. a drawing vertical grid lines) and a set of layers dedicated to rendering timeline objects (activities, events, milestones, …). The picture below depicts the layer stack. Applications can add as many timeline object layers as they like, allowing them to easily group objects and show or hide them all at once. Layers also support transparency so that overlapping timeline objects can be easily identified.

Customizable Timeline. When time matters to you.
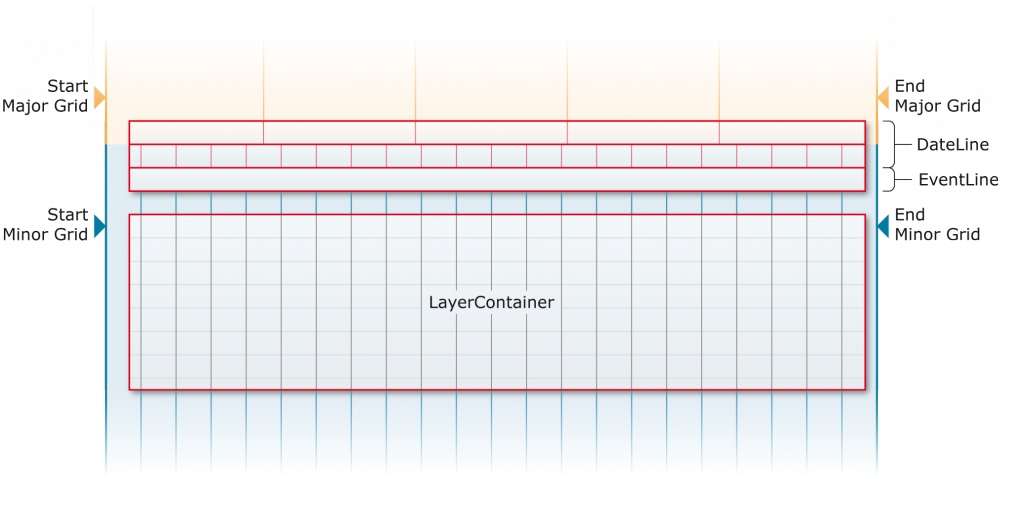
Each application has its own requirements for the timeline. Some require the week of the year to be shown next to the date, others want to show the number of the day in the year (for example ‘day 241’). The timeline has been designed with flexibility in mind. Its model can be replaced, its renderers can be replaced, even the entire timeline can be substituted with a custom subclass.
Paging. For staying focused.
If a scheduling application needs to deal with a large amount of timeline objects then it often makes sense to divide the timeline horizon into several pages / time spans. This way the data gets broken into smaller chunks that the Gantt chart can deal with more easily. The paging model manages the individual pages. It can be queried for the current page, the previous page, the next page, the first page, and the last page. The user interface provides a control that can be used to select individual pages.
Popups / Annotations. Details matter.
A bar underneath a timeline is a nice representation for an activity but it can only carry a limited number of information due to space restrictions. Popups / annotations that show up when the mouse cursor hovers over such a bar is a nice feature that can display a wealth of additional information that the planner might need to make a scheduling decision. FlexGantt’s popups can be customized in the same way that any Swing component can be customized. Different renderers can be mapped to different types of popup objects. The popup objects are looked up from a specialized popup policy. The image below shows the default popup renderer that displays popup objects in its serialized form.
Relationships. Linking data.
It is quite common that timeline objects have some kind of relationship with each other. Project planning software for example often defines constraints between them. Some examples for constraints are: ‘start after’, ‘finish before’, ‘same start’, ‘same end’. FlexGantt can visualize them by drawing lines betwen them. Each application has its own way of visualizing them (different colors and / or line styles for different constraints). By plugging in a custom relationship renderer it is possible to implement any kind of relationship rendering.
Split Screen. Side by side comparison.
A feature required by almost any planning and scheduling application is the ability to keep the data of two different models or two different sections of the same model in synch while scrolling horizontally. The FlexGantt framework includes a Dual Gantt Chart that is capable of doing exactly that. The user can split / unsplit the Gantt chart at any time. A horizontal divider can be used to resize the upper and lower part. Timeline objects can be dragged from one to another.

Drag & Drop Grid. Easy editing.
Timeline objects can be dragged and resized horizontally and dragged vertically. An invisible grid can be enabled during these drag & drop operations so that a timeline object can be more easily placed at a specific time. The grid gets controlled by a policy, which means that any kind of grid can be implemented. The default grid policy can be configured to make timeline objects snap to anything from millenium, centuries, decades, years, months, weeks, days, all the way to milliseconds.

Policy Controlled Behaviour. For total customization.
Scheduling applications vary too a large extent in the way they visualize information, edit data, and respond to user interaction. FlexGantt’s policy framework can be used to tailor the Gantt charts to these variations. Policies are small little decision makers and usually do not contain a lot of code. They are also stateless. In many cases they return flags (booleans) and commands only. The flags are used to control the program flow, while the commands are used to perform the actual modification of data (via a command stack with undo and redo capabilities).
Pluggable Renderers & Editors. Have things your way.
Swing defines several renderer and editor classes that are used for its UI components such as tree, table or list. FlexGantt does the same and defines renderers for tree table cells, column headers, popups, dateline models, timeline objects, eventline objects. Editors are available for tree table cells and timeline objects. A timeline object editor gets displayed in a transparent window within the right-hand side of the Gantt chart.
Command Framework. Including undo / redo.
FlexGantt provides a small but powerful command framework. It is used to support editing operations that can be undone and redone. The framework consists of commands, a command stack, a command stack listener and a progress monitor. Commands are executed, undone and redone via the Gantt chart, which internally uses a replaceable command stack. Commands are executed in their own thread in order to keep the user interface responsive. Command stack events are issued during the execution of the command. Progress monitors are used to display the progress made by a command. Sub-progress monitors are used for compound commands that consist of several other commands. Once a command has finished execution it will be added to the command stack‘s list of undoable commands. This list will be cleared when a command gets executed that can not be undone. The command framework uses a high level of abstraction so that an already existing command infrastructure (legacy code) can be reused.
Lazy Loading. For big data.
Depending on the application type the volume of data that needs visualization can be rather massiv. In these situations a user interface can only be fast and responsive if it uses a ‘lazy loading’ approach, which means that data will only be transferred from the server (or database) to the client when the user actually requests it. FlexGantt has been designed from the ground-up to support lazy loading. Example: objects that implement the tree table expansion listener interface will receive an event before the tree expands so that the child nodes of the expanding parent node can be loaded. The paging model is another example for infrastructure that supports lazy loading.
Multiline. Avoid overlapping objects.
The multiline feature enables a Gantt chart to display timeline objects within the same row but above and below each other. This way timeline objects that would otherwise overlap each other can be displayed without problems.

